A harbour can look like two different places within a single afternoon. Boats that floated beside a wall may settle toward mud. Steps emerge below a quay. Later, the water returns and the working waterfront seems to rebuild itself without anyone moving the harbour.
The tide is familiar enough to become background scenery. Yet it connects that changing waterline to bodies hundreds of thousands or millions of kilometres away. Why should their gravity make the sea rise and fall, rather than simply pull the whole planet in one direction?
The answer begins with a difference in pull. It ends with a coastline that has its own way of responding.
The Moon pulls on the land, too
A common explanation says that the Moon attracts seawater. That is true, but incomplete: it attracts rocks, people and the rest of Earth as well. The important feature is that the attraction is not equally strong everywhere.
The side nearest the Moon experiences a stronger lunar pull than Earth's centre. The far side experiences a weaker pull. Relative to the centre, the near side is pulled moonward more strongly, while the far side is left behind. Both differences tend to stretch the planet along the Earth–Moon direction. Nothing needs to repel the far-side water. Royal Museums Greenwich explains this difference in gravitational attraction.
This is a tidal force: the effect of gravity changing across an extended object. Isaac Newton connected ocean tides with the gravity of the Moon and Sun in 1687. The distinction between ordinary attraction and its variation across Earth matters as much as the discovery that both bodies exert gravity. NOAA traces the explanation to Newton.
A little deeper: why distance matters so much
Two bulges are a starting model
Imagine an ideal Earth covered by an uninterrupted ocean that can settle into balance with the tidal forces. The familiar drawing has two raised regions on opposite sides. It captures the stretching tendency and helps explain why two high waters are so common.
But it should not be mistaken for a photograph of the real ocean. Continents interrupt the water, and ocean basins cannot instantly rearrange themselves. The useful idea in the drawing is the forcing pattern; the actual water must move through a complicated world. NOAA introduces the two-bulge picture.
Tides are very long-period waves. At a coast, we notice their changing surface height: the highest level is high tide, the lowest is low tide, and their difference is the tidal range. This is a different scale of motion from the small waves breaking on a beach. NOAA defines tides and tidal range.
Why tomorrow's tide usually arrives later
Earth rotates while the Moon moves along its orbit in the same general direction. After one ordinary day, a place on Earth has to turn a little farther to face the Moon again. The average lunar day is therefore about 24 hours and 50 minutes.
The main twice-daily lunar rhythm has successive peaks roughly 12 hours and 25 minutes apart. That helps explain why a familiar high tide often occurs later the following day. These are useful average rhythms, not a timetable for every beach. NOAA's lunar-day explanation includes an animation.
Some coasts have two similar high waters; others have two noticeably unequal ones. Some have predominantly one high and one low water per lunar day. These patterns are called semidiurnal, mixed semidiurnal and diurnal tides. An individual harbour responds to several rhythms together. Compare the patterns in NOAA's tidal-cycle guide.
The Sun changes the range
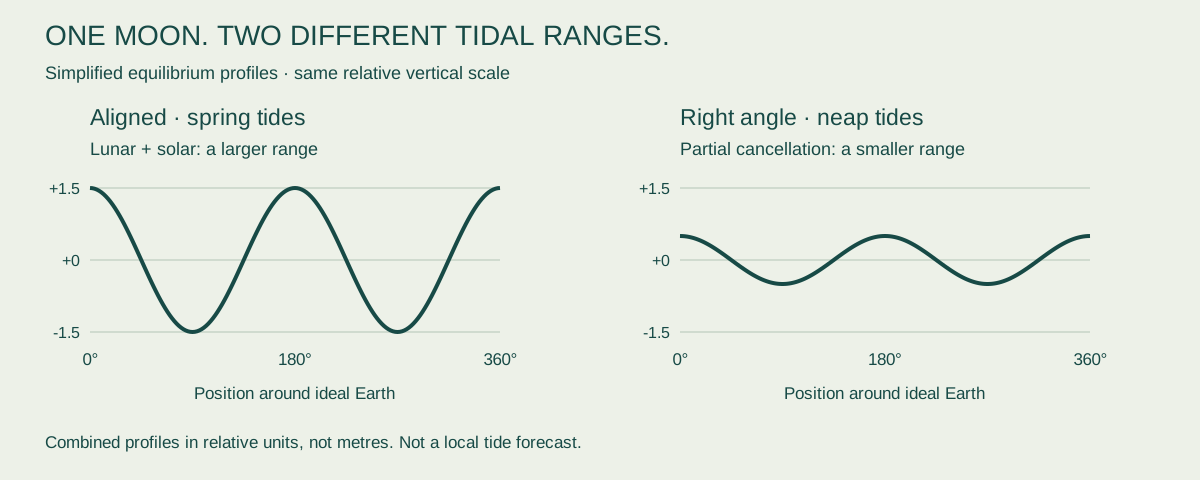
Near new and full moon, the Sun, Earth and Moon are approximately aligned. Their tidal contributions reinforce one another, generally producing a greater difference between high and low water: spring tides. The name does not mean that these tides belong to the spring season.
Near first and third quarter, the Sun and Moon lie in roughly perpendicular directions as seen from Earth. Their tidal contributions partly counteract, giving the smaller ranges called neap tides. The solar contribution is roughly half the lunar one, so it reduces the variation without normally eliminating it. NOAA explains the changing alignment.
The interactive model below isolates this relationship. Turn the angle from alignment to a right angle and watch the combined curve become shallower. Its numbers are relative units. They demonstrate addition and partial cancellation; they do not say how many metres the water will rise at your coast.
The coastline has a say
A narrow entrance, a shallow shelf or a funnel-shaped bay can change the water's response dramatically. Bay geometry can amplify a tide; friction and restricted passages can reduce it. River flow can complicate the level in an estuary. That is why knowing the Moon's position is not enough to predict a harbour's waterline.
Weather changes the observed level as well. Winds can push water toward or away from shore, and atmospheric pressure can raise or depress it. A tide prediction and the water actually measured on a stormy day can therefore differ. NOAA describes these local influences.
When gears learned to predict the sea
In 1872, William Thomson, later Lord Kelvin, designed a tide-predicting machine built by A. Légé & Co. It combined ten astronomical components mechanically, tracing a tidal curve for a chosen location. According to the Science Museum, it could draw a year's curves for one harbour in about four hours. See the original machine and its workings.
The principle survives electronic computing: combine repeating components whose strengths and timing have been determined from local observations. These are harmonic constituents. Each is comparatively simple; their sum can produce an intricate water-level record. NOAA explains the components and provides technical reading.
The harbour's changing face is therefore neither arbitrary nor controlled by the Moon alone. Gravity supplies a repeating influence, the ocean carries it, and the coast reshapes it. The next exposed step below a quay is a small, local expression of that much larger conversation.
EXPLORE THE IDEA
When two tidal influences combine
Change the angle between the Sun and Moon as viewed from Earth. Compare the solid combined curve with the two dashed contributions.
Long dash: MoonShort dash: SunSolid: combined
At 0° and 180°, the contributions reinforce. At 90°, they partly cancel. Both new-moon and full-moon alignment can therefore give spring tides.
Fixed-alignment, equatorial equilibrium model: no continents, changing distances, latitude effects, friction or weather. Curves show relative height around an ideal Earth, with their mean removed; they are not a time series or local tide forecast. Lunar amplitude is 1; solar amplitude is rounded to 0.5. The vertical scale stays fixed.